Active investors put in their time and effort to find investment avenues that can produce risk-adjusted alpha (in layman terms, which can produce more return without the need to take excessive risk).
Picking a benchmak
To what do we compare the returns obtained?
Finding an appropriate benchmark is pivotal in building our perspective for any particular fund.
Generally, we would observe the composition of the fund and find a comparable peer to use as a benchmark. If no such peer is available, the alternative is to look into taking weighted average of a number of indices to somewhat replicate our portfolio.
In this post, I’m going to assume that your portfolio is diversified enough such that we can use FTSE 100 as the benchmark.
What Next?
Next, we will calculate the rolling returns of the benchmark over different time spans.
Keep in mind that there are economic cycles which leads to huge fluctuations in the dataset. Hence, it is advisable to consider as large a timespan as possible so as to nullify the pull that outliers will have on our expected returns.

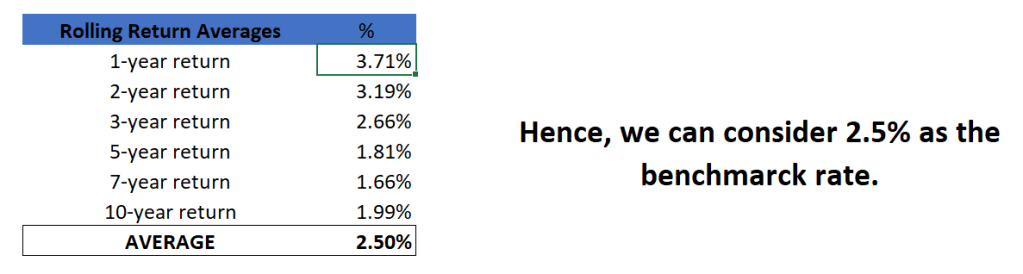
Here, I have the monthly Adjusted Close for FTSE100 from 1st July 1995 to 1st June 2020. Using this data, calculate the 1 year, 2 years, 3 years, 5 years, 7years, and 10 years rolling average for the index. Then take the average to obtain the average 1 year return, average 2 year return, and so on.
Eventually we will find the simple average for all of them and use it as the benchmark rate of return.
Please note that based on the expected timespan of your portfolio, you can use weighted average to find your benchmark rate of return.
Additional Tip:
It is advisable to use conditional formatting based on colour scale for the rolling returns column as it will help better visualise the broader market movements.
I’m attaching my working files here for your reference. Hope this helps!
